Bentheimer Sandstone Sample#
This sample is a subset of a 5 micrometer voxel length micro-CT scan of a Bentheimer sandstone sample, posted by Rodolfo Victor at the Digital Rocks Portal.
Note
If you plan to use this data, please remember to cite the data and the related publications.
Go to the project in the Digital Rocks Portal: https://www.digitalrocksportal.org/projects/29. Click on BE_CT_Oxyz_0001_0001_0001.
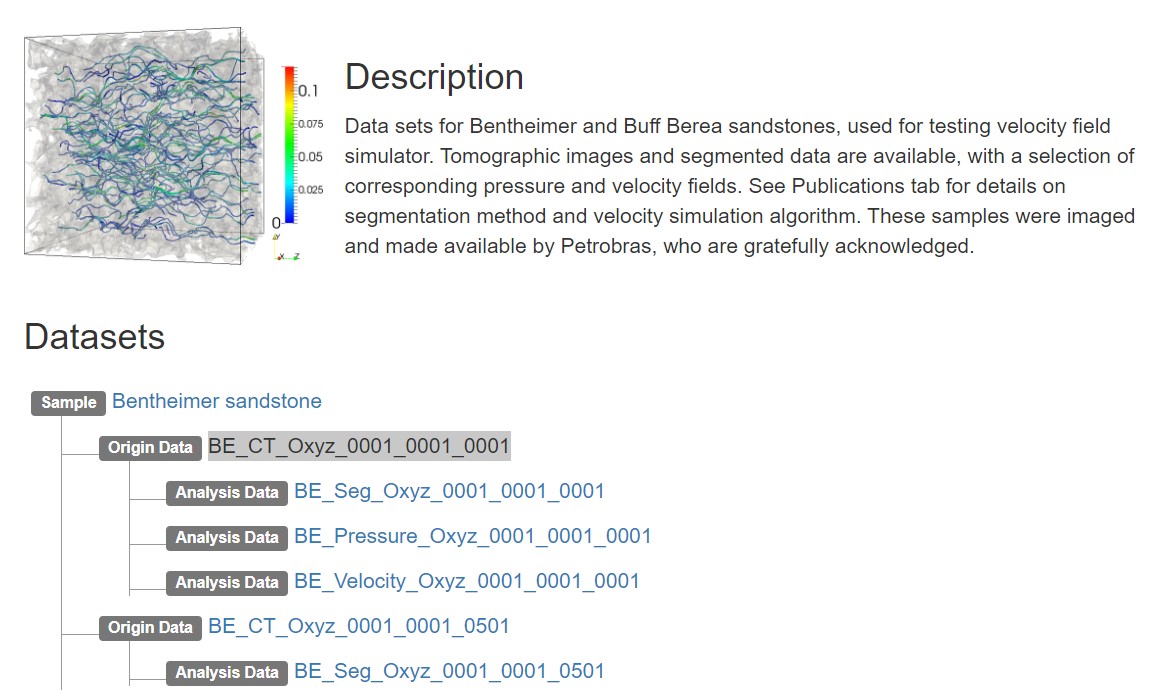
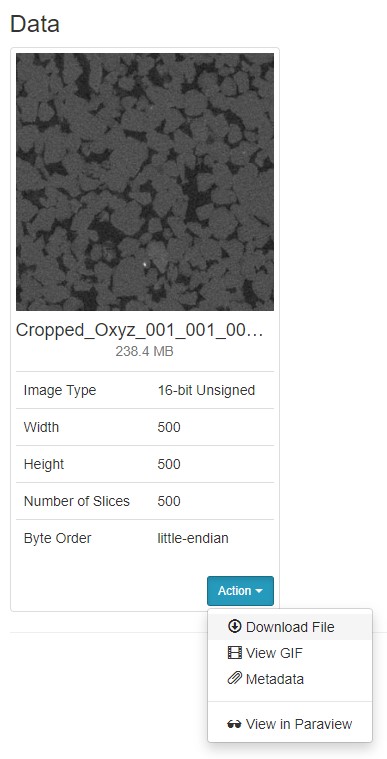
Pay attention to the metadata, we’ll need it later. An extra piece of information: this raw data is exported from Fiji/ImageJ, so it is in Fortran file order. Click Action->Download File.
Repeat the process for the segmentation file (BE_Seg_Oxyz_0001_0001_0001), simulated pressure field (BE_Pressure_Oxyz_0001_0001_0001), and simulated velocity field (BE_Velocity_Oxyz_0001_0001_0001).
Let’s import the raw files into a RockVerse voxel image. In this example we’ll use 8 chunks, halving the total number of voxels in each direction:
[ ]:
import rockverse as rv

bentheimer_original_ct = rv.voxel_image.import_raw(
    rawfile='/path/to/rawdata/Bentheimer/Cropped_Oxyz_001_001_001_Nxyz_500_500_500.raw',
    raw_file_order='F',                                #<- Fortran raw file order
    store='/path/to/imported/Bentheimer/original_ct',  #<- path to the imported the voxel image
    shape=(500, 500, 500),                             #<- From metadata, image size
    dtype='<u2',                                       #<- From metadata, little-endian 16-bit unsigned integer
    offset=0,                                          #<- From metadata
    voxel_length=(5, 5, 5),                            #<- From metadata
    voxel_unit='um',                                   #<- From metadata, micrometer
    chunks=(250, 250, 250),                            #<- Our choice of chunk size will give a 2x2x2 chunk grid
    field_name='Attenuation',                          #<- Our choice for field name (X-ray attenuation)
    field_unit='a.u.',                                 #<- Our choice for field units (arbitrary units)
    description='Bentheimer sandstone original X-ray CT',
    overwrite=True                                     #<- Overwrite if file exists in disk
    )

bentheimer_segmentation = rv.voxel_image.import_raw(
    rawfile='/path/to/rawdata/Bentheimer/Seg_Oxyz_0001_0001_0001.raw',
    raw_file_order='F',
    store='/path/to/imported/Bentheimer/segmentation',
    shape=(500, 500, 500),
    dtype='|u1',  #<- From metadata, 8-bit unsigned integer
    offset=0,
    voxel_length=(5, 5, 5),
    voxel_unit='um',
    chunks=(250, 250, 250),
    field_name='Segmentation',
    field_unit='',
    description='Bentheimer sandstone segmentation',
    overwrite=True
    )

bentheimer_pressure = rv.voxel_image.import_raw(
    rawfile='/path/to/rawdata/Bentheimer/Pressure_Oxyz_0001_0001_0001.raw',
    raw_file_order='F',
    store='/path/to/imported/Bentheimer/pressure',
    shape=(500, 500, 500),
    dtype='<f4',  #<- From metadata, little-endian 32-bit float
    offset=0,
    voxel_length=(5, 5, 5),
    voxel_unit='um',
    chunks=(250, 250, 250),
    field_name='Pressure',
    field_unit='a.u.',
    description='Bentheimer sandstone pressure field',
    overwrite=True
    )

bentheimer_x_velocity = rv.voxel_image.import_raw(
    rawfile='/path/to/rawdata/Bentheimer/Xvelocity_Oxyz_0001_0001_0001.raw',
    raw_file_order='F',
    store='/path/to/imported/Bentheimer/x_velocity',
    shape=(500, 500, 500),
    dtype='<f4',
    offset=0,
    voxel_length=(5, 5, 5),
    voxel_unit='um',
    chunks=(250, 250, 250),
    field_name='X Velocity',
    field_unit='a.u.',
    description='Bentheimer sandstone x component velocity field',
    overwrite=True
    )

bentheimer_y_velocity = rv.voxel_image.import_raw(
    rawfile='/path/to/rawdata/Bentheimer/Yvelocity_Oxyz_0001_0001_0001.raw',
    raw_file_order='F',
    store='/path/to/imported/Bentheimer/y_velocity',
    shape=(500, 500, 500),
    dtype='<f4',
    offset=0,
    voxel_length=(5, 5, 5),
    voxel_unit='um',
    chunks=(250, 250, 250),
    field_name='Y Velocity',
    field_unit='a.u.',
    description='Bentheimer sandstone y component velocity field',
    overwrite=True
    )

bentheimer_z_velocity = rv.voxel_image.import_raw(
    rawfile='/path/to/rawdata/Bentheimer/Zvelocity_Oxyz_0001_0001_0001.raw',
    raw_file_order='F',
    store='/path/to/imported/Bentheimer/z_velocity',
    shape=(500, 500, 500),
    dtype='<f4',
    offset=0,
    voxel_length=(5, 5, 5),
    voxel_unit='um',
    chunks=(250, 250, 250),
    field_name='Z Velocity',
    field_unit='a.u.',
    description='Bentheimer sandstone z component velocity field',
    overwrite=True
    )
[2025-01-09 12:30:51] (Attenuation) Importing raw file: 100%|>>>>>>>>>>| 8/8 [00:02<00:00,  3.37chunk/s]
[2025-01-09 12:30:54] (Segmentation) Importing raw file: 100%|>>>>>>>>>>| 8/8 [00:00<00:00,  8.38chunk/s]
[2025-01-09 12:30:55] (Pressure) Importing raw file: 100%|>>>>>>>>>>| 8/8 [00:03<00:00,  2.04chunk/s]
[2025-01-09 12:30:59] (X Velocity) Importing raw file: 100%|>>>>>>>>>>| 8/8 [00:04<00:00,  1.85chunk/s]
[2025-01-09 12:31:04] (Y Velocity) Importing raw file: 100%|>>>>>>>>>>| 8/8 [00:04<00:00,  1.89chunk/s]
[2025-01-09 12:31:08] (Z Velocity) Importing raw file: 100%|>>>>>>>>>>| 8/8 [00:05<00:00,  1.49chunk/s]
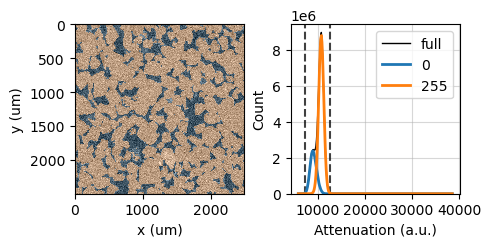
The images are now available as a RockVerse voxel image in disk, at the path given in the store parameters. We can do a quick visualization of the original X-ray with overlayed segmentation data:
[2]:
%matplotlib qt
viewer = rv.OrthogonalViewer(
    image=bentheimer_original_ct,
    segmentation=bentheimer_segmentation,
    segmentation_alpha=0.25,
    show_xz_plane=False,
    show_zy_plane=False)
viewer.show_xz_plane = False
viewer.show_zy_plane = False
viewer.layout = 'horizontal'
viewer.figure
[2025-01-09 12:31:15] Histogram Attenuation (min/max): 100%|>>>>>>>>>>| 8/8 [00:00<00:00, 26.67chunk/s]
[2025-01-09 12:31:15] Histogram Attenuation (reading segmentation): 100%|>>>>>>>>>>| 8/8 [00:04<00:00,  1.73chunk/s]
[2025-01-09 12:31:20] Histogram Attenuation (counting voxels): 100%|>>>>>>>>>>| 8/8 [00:03<00:00,  2.50chunk/s]
[2]: